When Langfuse Reported 156 Tokens for a 16.862-Token Claude Code Request
My coding-agent setup includes an observability layer. I run Langfuse locally to trace my interactions with the agent and understand what happens behind the scenes. That setup eventually exposed a token-tracking bug in the documented Claude Code integration, which I reported and Langfuse later fixed upstream .
When I started using Claude Code to build Yubarta, I followed Langfuse’s documented Claude Code integration. After the configuration, the trace appeared, so I assumed the integration was working. Then I tested it with a deliberately small prompt:
Explain in a very brief manner what does this project
Langfuse reported 22 input tokens and 134 output tokens: 156 in total.
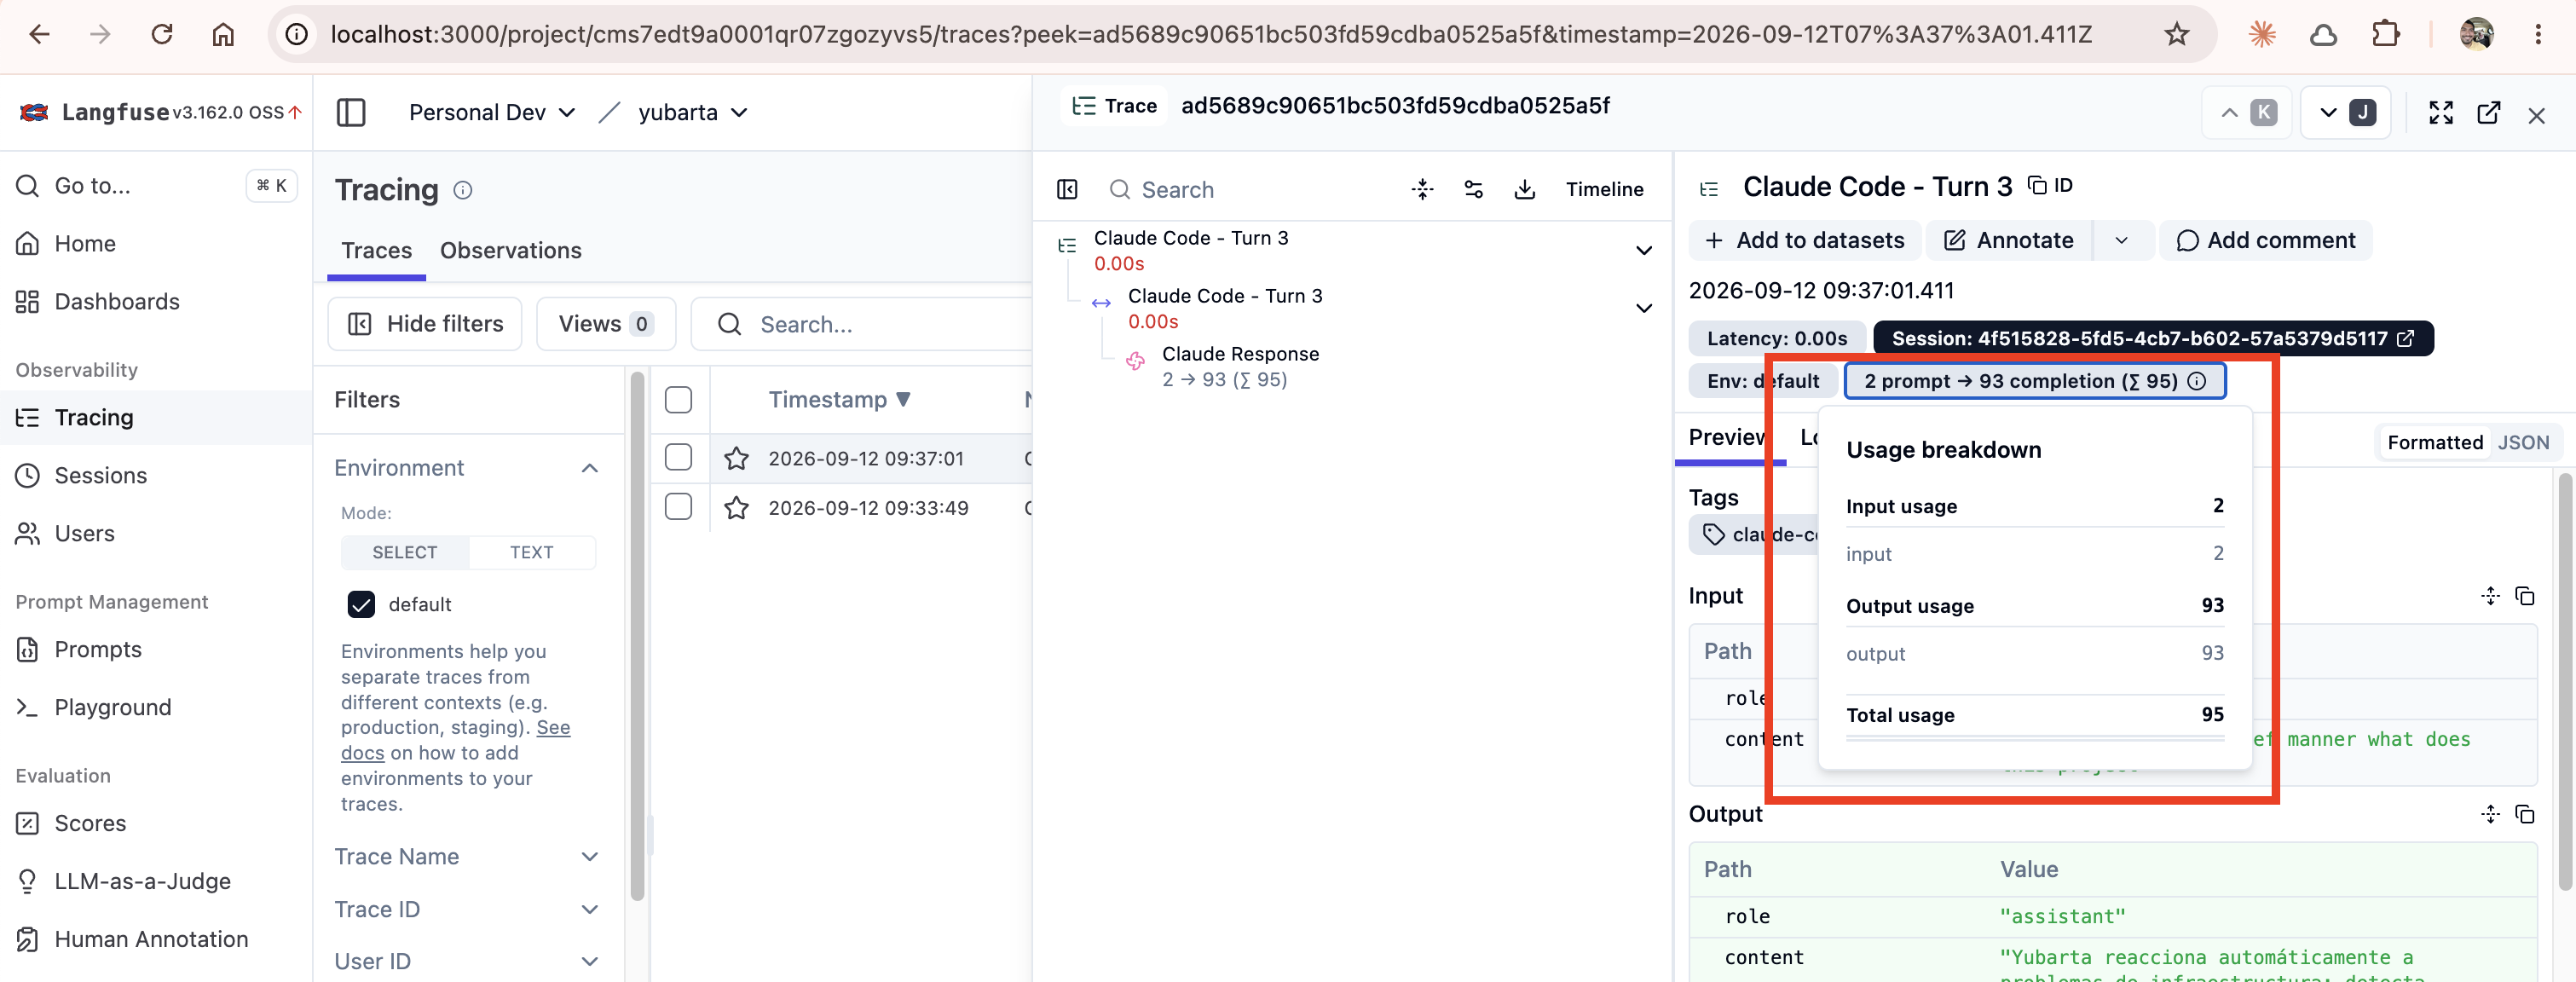
This is a recreated trace, not the original trace from the investigation. It uses the same prompt and reproduces the same failure mode.
The response was short, but the number did not make sense. A Claude Code request contains more than the text typed into the terminal. It can also include project instructions, CLAUDE.md, tool definitions, previous messages, tool results, and files already in context.
I did not know the correct number yet. I only knew that 156 was too small.
The transcript told a different story
Claude Code stores local session transcripts as JSONL files:
~/.claude/projects/<project>/<session-id>.jsonl
Each line is an independent JSON object. Depending on its type, it can represent a user message, assistant message, tool interaction, or metadata. Anthropic documents the transcript location, although the internal format can change between Claude Code versions.
The relevant assistant entry looked like this (with unrelated fields removed):
{
  "type": "assistant",
  "message": {
    "model": "claude-sonnet-4-6",
    "role": "assistant",
    "content": [
      {
        "type": "text",
        "text": "..."
      }
    ],
    "usage": {
      "input_tokens": 3,
      "cache_creation_input_tokens": 1809,
      "cache_read_input_tokens": 14885,
      "output_tokens": 165
    }
  }
}
The provider-reported total was:
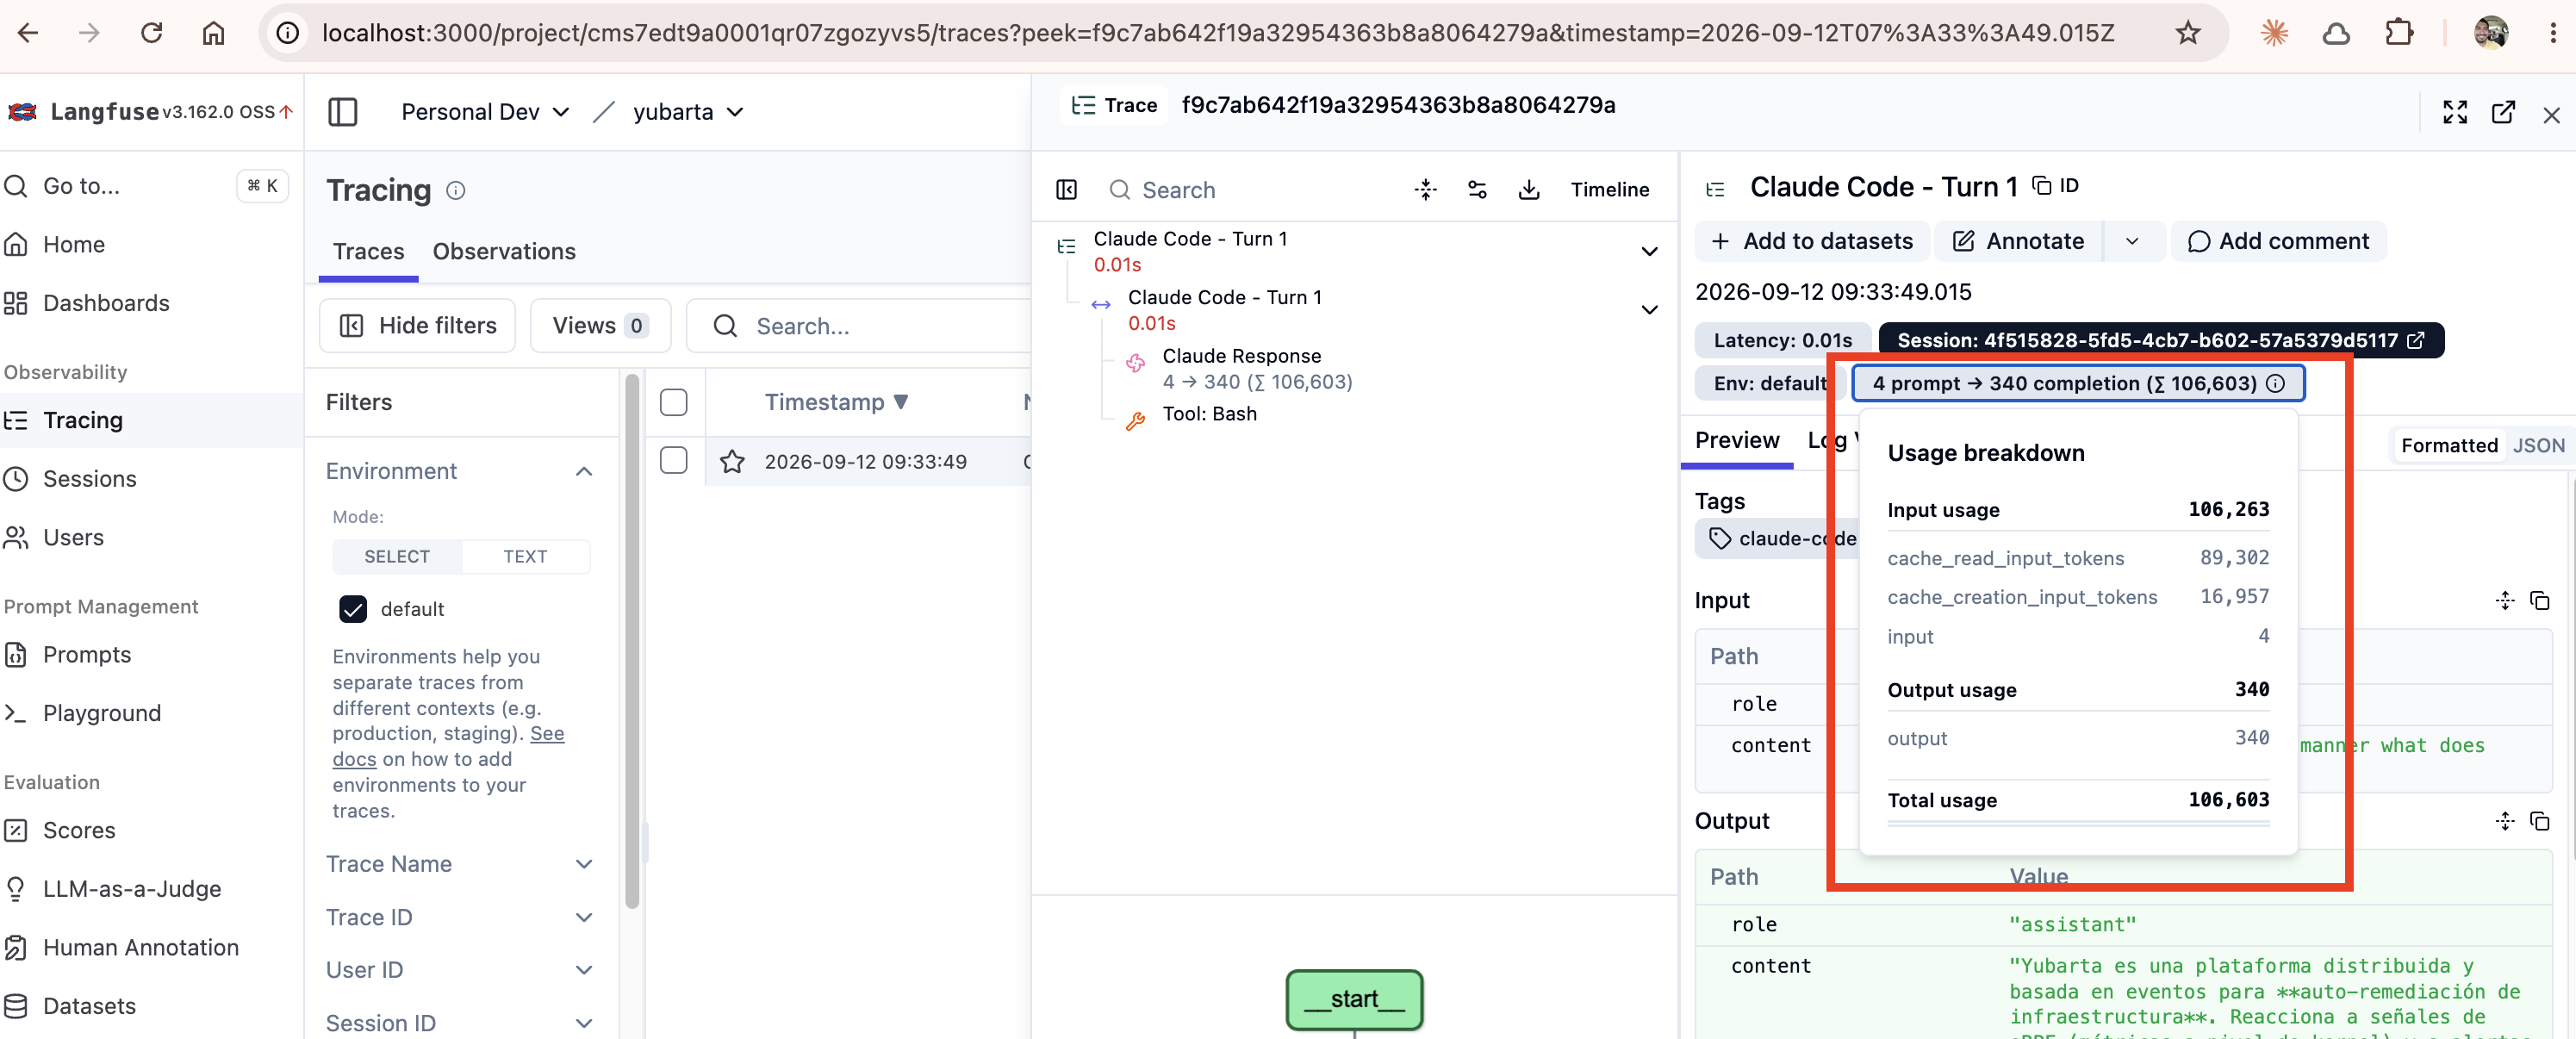
3 + 1.809 + 14.885 + 165 = 16.862 tokens
Langfuse had underreported token usage by a factor of about 108.
The three input tokens were not an error. Anthropic reports fresh input, cache creation, and cache reads separately. Most of this request came from cached context. The short prompt was only the visible tip of a much larger model call.
The integration discarded the exact usage
I inspected the version of the hook available when I reported the bug. It parsed each transcript entry and extracted the assistant’s model, content, role, and message ID. It never read message.usage.
The exact data already existed. The integration simply did not send it.
Langfuse can ingest provider-reported usage or estimate it from the model and visible text. Ingested values take priority. Its token and cost tracking documentation also warns that tokenization estimates for modern Claude models are not exact and recommends sending the counts returned by the provider when possible.
Without usage_details, estimation was the only option. Langfuse could estimate the tokens in the recorded text, but it could not reconstruct Claude Code’s complete context or its cache activity.
My first fix aggregated the four usage fields across the assistant messages in a turn and attached them to the Langfuse generation:
usage_details = {
    "input": input_tokens,
    "output": output_tokens,
    "cache_read_input_tokens": cache_read,
    "cache_creation_input_tokens": cache_creation,
}
After that change, Langfuse displayed 16.862 provider-reported tokens instead of 156 estimated tokens.
The upstream fix was better
I reported the bug in langfuse-docs issue #2718. The report included the transcript evidence, the before-and-after numbers, the root cause, and my proposed implementation.
A maintainer labeled the issue as a bug, and Langfuse fixed it in pull request #2984.
They did not copy my patch. They accepted the diagnosis and implemented the correction at a better level of abstraction.
My version combined all assistant messages from one user turn into a single Langfuse generation. The upstream version creates one generation per assistant message and attaches that message’s usage directly to it.
That distinction matters because one user prompt can produce several model calls. Claude can request a tool, receive its result, and then generate another response. Each call has its own usage and cache behavior.
My patch could report how many tokens the complete turn consumed. The upstream fix can also attribute that usage to each individual model call.
Documentation as code still needs production rigor
The faulty hook lived inside an MDX page as a fenced code block, not as a standalone Python module. Keeping the page in Git did not make the snippet executable documentation. The page could pass review, link checks, and an MDX build without ever running the Python inside it.
When readers copy an example and depend on it as an integration, that code needs the same rigor as production code. Critical examples should live as tested files and then be embedded or synchronized into the documentation.
I cannot prove that embedding the hook in MDX caused this bug. I can say that it gave the omission fewer opportunities to fail before reaching users.
Verifying the instrument
The code change was small. Finding it required following the measurement through every layer: provider metadata, Claude Code transcript, hook parser, Langfuse generation, and dashboard.
That was the process I followed: I noticed an implausible number, checked the source data, traced where the information was lost, and turned the discrepancy into a reproducible bug report.
That is the lesson I took from this episode. Observability can fail quietly. A missing trace is obvious. A precise-looking but incomplete metric is more dangerous because it already looks like an answer.
Langfuse behaved correctly with the data it received. The hook had discarded the better data before it arrived. Once the integration forwarded the provider usage, the 156-token request became what it had been all along: a 16.862-token model call, with most of its input served from cache.